This article summarizes how concrete behaves in
simulations where the truth is known. The goal is to give a trial
analyst evidence on three questions:
- Does the targeting step actually reduce the bias of the plug-in estimate?
- Are the influence-function standard errors trustworthy?
- Do the confidence intervals cover the truth at the nominal rate?
The figures are generated from the package’s committed
referee-simulation results by
scripts/make-sim-evidence-figures.R; the simulations
themselves are in scripts/sim-data/referee-sims/ and are
reproducible from a fixed seed grid.
The scenarios
Each scenario simulates continuous-time data with two competing events plus censoring, a binary baseline treatment, and five baseline covariates. The headline figures use 100 replicates at n = 500.
| Scenario | What it stresses |
|---|---|
| Proportional hazards | Well-specified, Cox-compatible baseline |
| Non-proportional hazards | Time-varying treatment/covariate effects |
| Rare early events | Low early event rate, hard early target times |
| Positivity / informative censoring | Treatment imbalance and informative censoring |
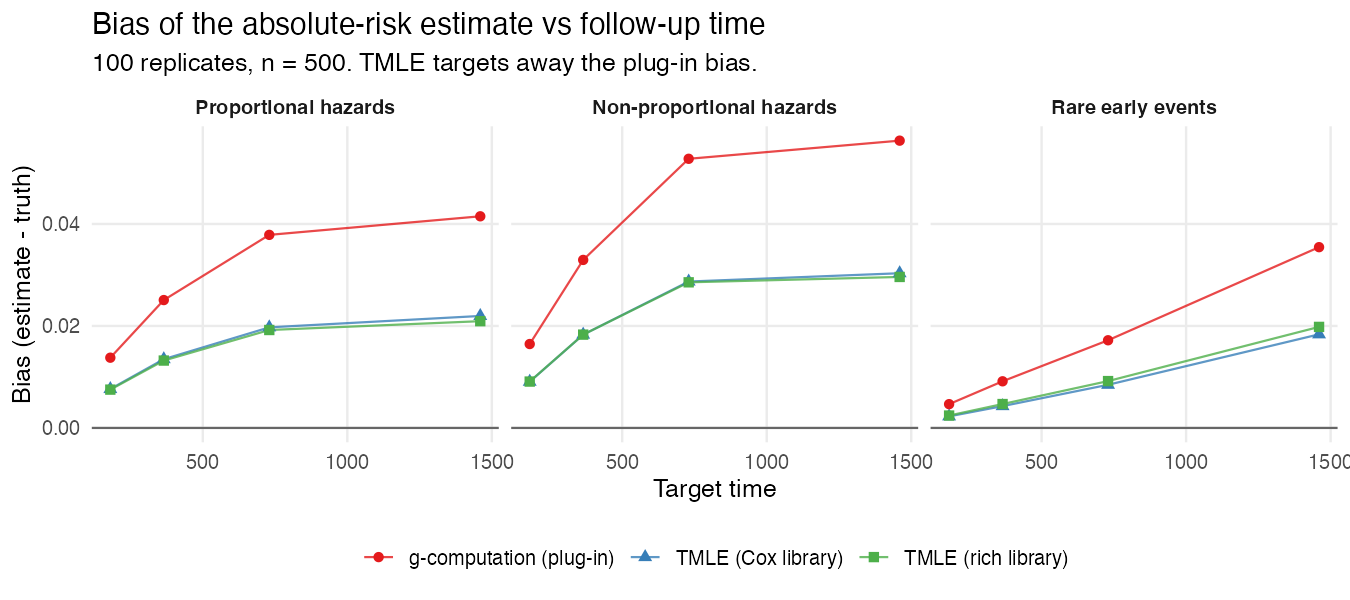
Result 1: TMLE reduces the plug-in bias
The g-computation plug-in (red) inherits the bias of the hazard fit and drifts further from the truth as follow-up lengthens. The one-step TMLE update (blue, green) targets that bias away. Averaged over scenarios and target times, the mean absolute bias falls from about 0.029 for the plug-in to about 0.015 for TMLE — roughly a halving — and the two TMLE libraries (Cox-only vs a richer learner library) behave similarly here.
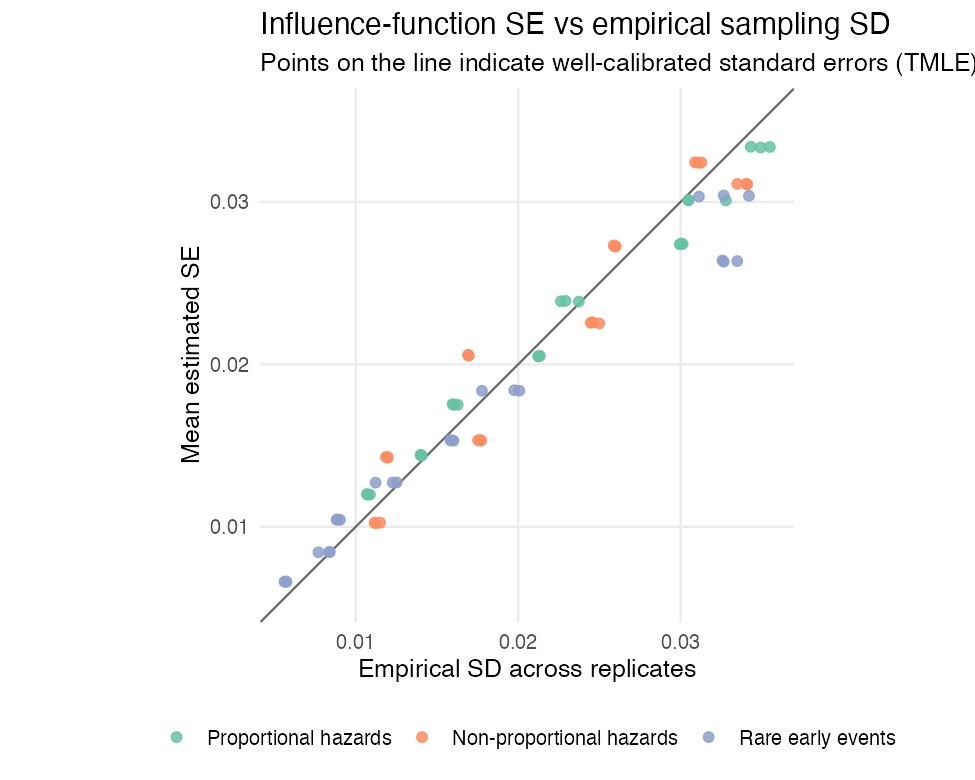
Result 2: the standard errors are well calibrated
A standard error is trustworthy if, across replicates, the mean estimated SE matches the empirical standard deviation of the point estimates. For the TMLE absolute-risk estimates these track the identity line closely — the mean ratio of estimated SE to empirical SD is about 1.01.
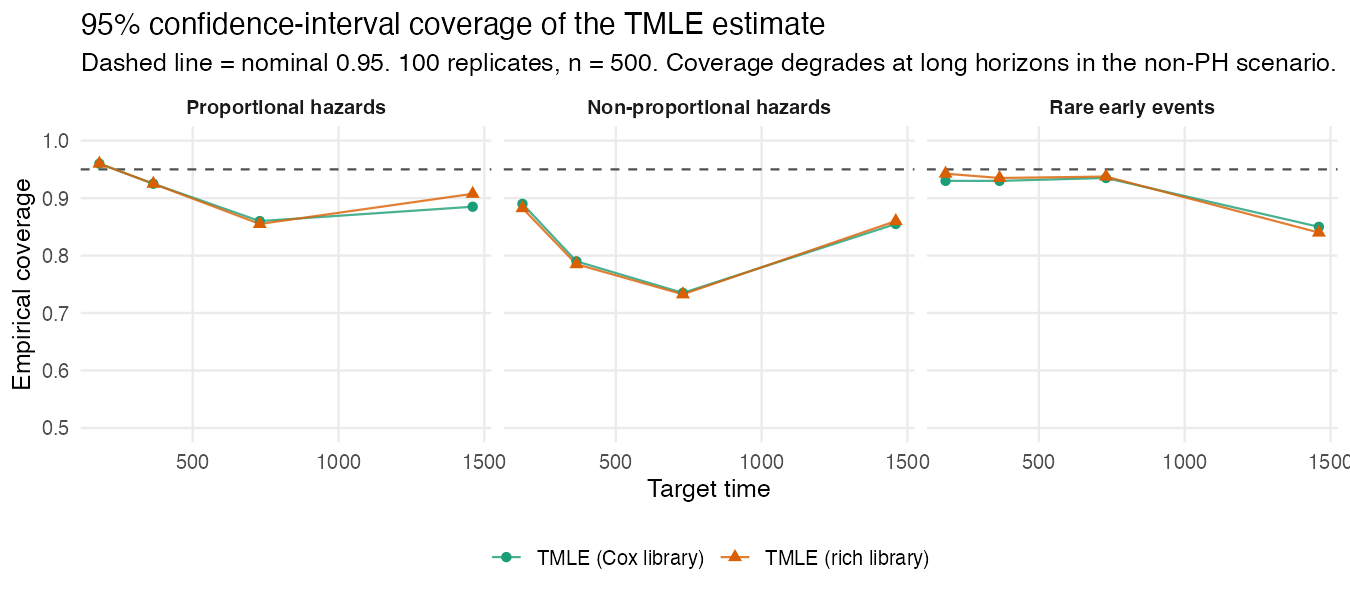
Result 3: coverage is near-nominal, with a caveat at long horizons
Coverage is close to the nominal 95% at short and medium target
times. At the longest horizons in the non-proportional-hazards
scenario it degrades: this is where a small residual
finite-sample bias is largest relative to the standard error, so the
interval is centered slightly off. This is the expected behavior of a
one-step estimator at finite n, and it is the practical reason to (a)
inspect getTmleDiagnostics(), (b) prefer a richer hazard
library when proportional hazards is implausible, and (c) interpret
very-long-horizon estimates cautiously.
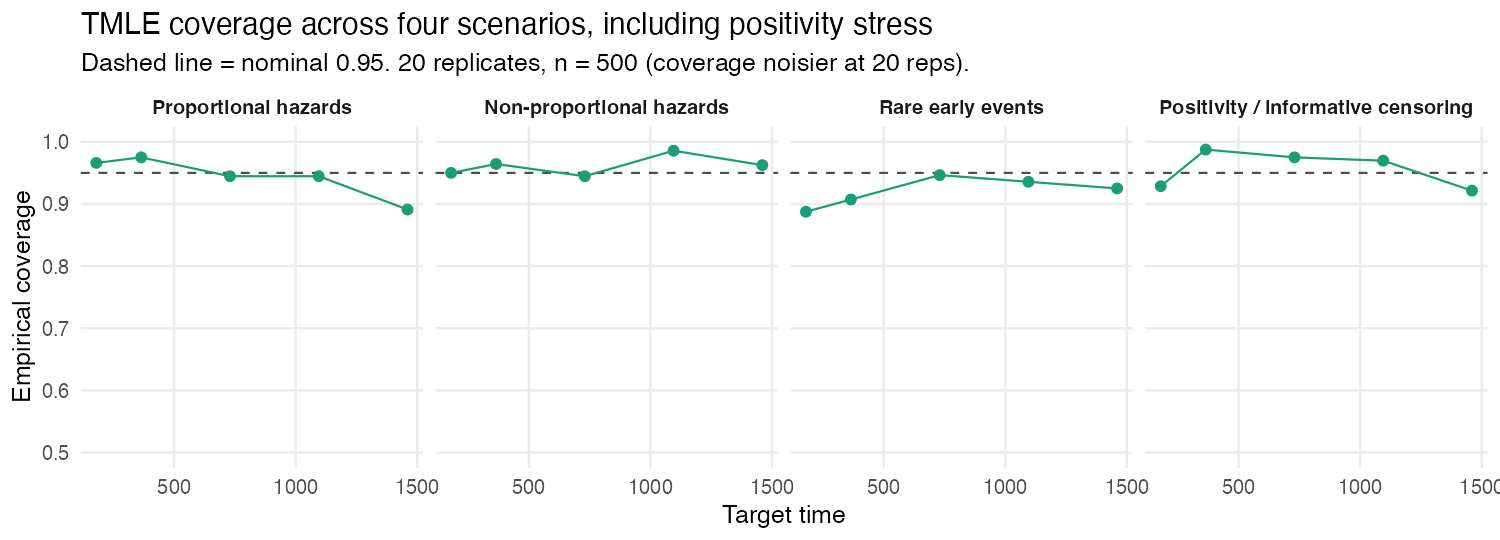
Adding the positivity / informative-censoring scenario (20 replicates, so coverage is noisier) shows the same qualitative picture across all four settings:
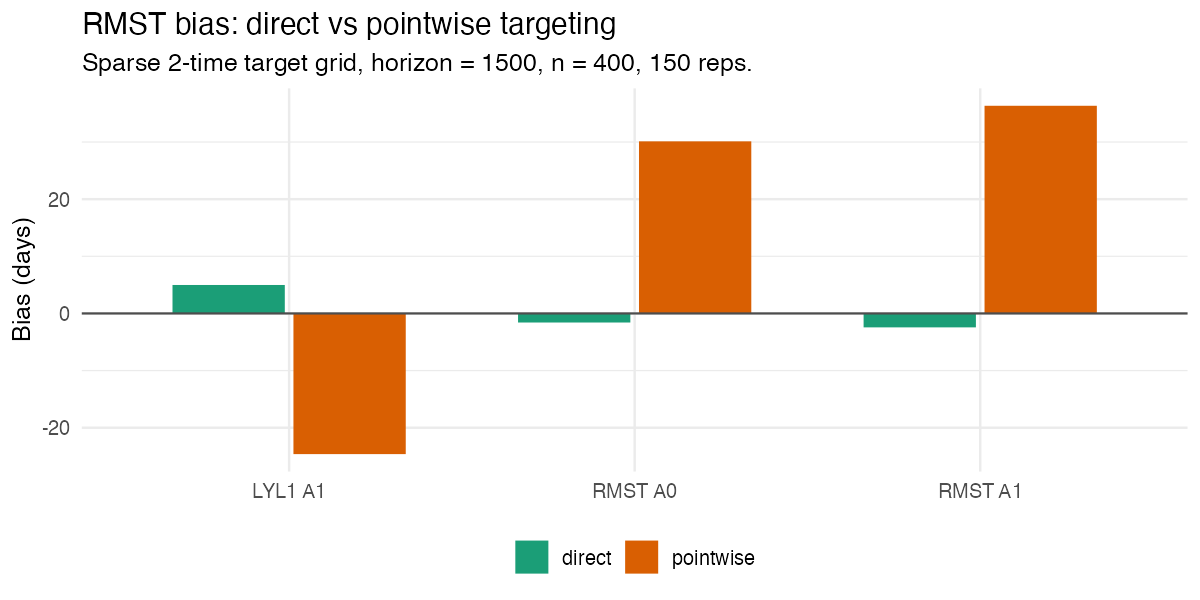
Direct vs pointwise RMST targeting
concrete offers two ways to estimate the restricted mean
survival time: getRMST() integrates the pointwise-targeted
absolute risks, while targetRMST() fluctuates the hazards
to solve the RMST estimating equation directly (see the How concrete works article). The
simulation below uses exponential cause-specific hazards (so the true
RMST and life-years-lost have closed forms) and a deliberately
sparse two-time target grid, which is where the
difference shows up.
The direct method substantially reduces bias, because it integrates over the full event-time grid and targets the RMST functional itself rather than relying on a crude trapezoid of a few targeted risks:
That lower bias translates into confidence-interval coverage closer to nominal:
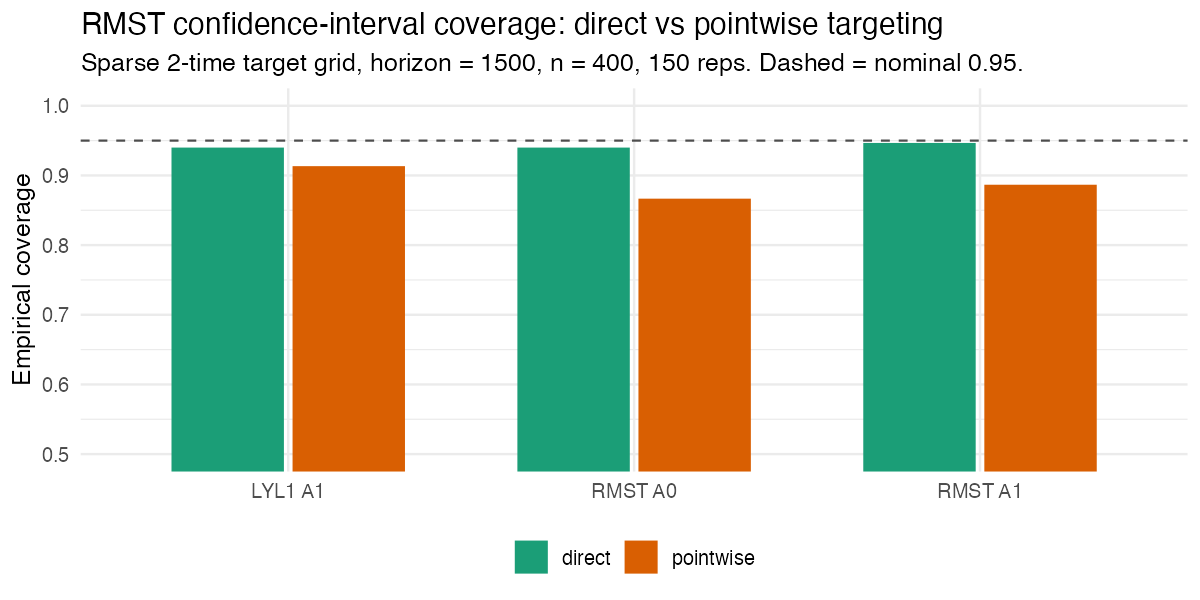
With a dense target grid the two approaches converge; the direct method is the one to prefer for sparse grids, rare events, and long horizons.
Result 4: type-I error is nominal under the null
Effect-scenario coverage says little about what happens when there is nothing to find, so the core absolute-risk TMLE was run on a null DGP — two competing events plus censoring, with a treatment that affects neither cause (160 replicates, n = 500 per arm, target time inside the follow-up horizon):
| Quantity | Value |
|---|---|
| Type-I error of the risk-difference Wald test (α = 0.05) | 0.050 |
| Risk-difference coverage at the true value 0 | 0.950 |
| SE calibration (empirical SD / mean IF-SE) | 0.98 |
| Per-arm absolute-risk bias | ≤ 0.003 |
The Wald test rejects a true null at exactly its nominal rate, which is the property a primary-endpoint analysis has to have.
Result 5: standard errors under stratified randomization
Most phase-3 trials randomize within strata using permuted blocks,
and the usual iid influence-function variance is then conservative — it
ignores the between-arm-within-stratum variance the design removes.
Passing the randomization strata via Strata applies the
Bugni–Canay–Shaikh / Ye–Shao correction to every reported standard
error. The validation (150 replicates per cell, n = 600, permuted blocks
of 4 within 4 prognostic strata) checks the three behaviors the theory
predicts:
| Cell | empirical SD / mean SE (iid) | (strata-corrected) | Coverage |
|---|---|---|---|
| Models unadjusted for the stratum | 0.82 (conservative) | 0.88 | 0.98 |
| Models adjusted for the stratum | 0.86 | 0.86 (correction ≈ 0) | 0.97 |
| Simple-randomization control | 0.81 | — | 0.98 |
The correction tightens the SEs exactly when the working models do not absorb the stratification, reduces to the iid SE (to four decimals) when they do, and never went anti-conservative. The simple-randomization control attributes the residual conservatism to small-sample behavior common to all cells, not to the correction.
Takeaways for a trial analysis
- The targeting step is doing real work: it consistently reduces the plug-in bias, which is the reason to use TMLE rather than a plain g-formula plug-in.
- Influence-function standard errors are reliable, so the reported intervals are meaningful — and the type-I error of the risk-difference test is nominal under the null.
- If randomization was stratified, pass
Strata: the corrected standard errors recover precision the iid variance gives away, and reduce to the iid answer when the models already adjust for the strata. - Trust short-to-medium-horizon estimates most; at long horizons under likely non-proportional hazards, lean on the diagnostics and a flexible hazard library, and report the convergence status.
Reproducing these figures
# Re-plot from the committed simulation summaries (no simulation is run):
source("scripts/make-sim-evidence-figures.R")

# Re-run the simulations themselves (heavy; uses a fixed seed grid):
# see scripts/sim-data/referee-sims/run_pilot.R

# The direct-vs-pointwise RMST comparison (closed-form truth) is self-contained:
# Rscript scripts/make-rmst-comparison.R 150 400

# The null / type-I validation and the stratified-randomization SE validation
# are self-contained (closed-form or mega-MC truths, fixed seeds):
# Rscript scripts/dev-null-typeI.R
# Rscript scripts/dev-strata-validation.R
# Rscript scripts/dev-strata-control.R